

Products and services

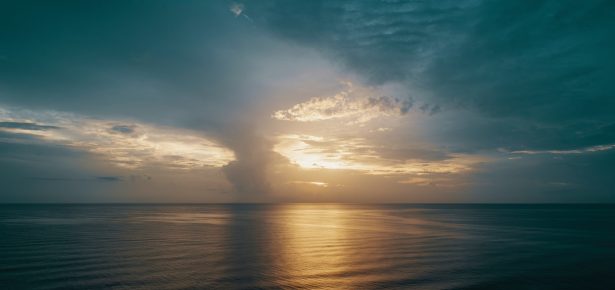
Hi, there! My name is Kris Karnauskas, and I’m a professor and ocean/climate scientist at the University of Colorado in Boulder, Colorado, USA. Back in 2015, when I moved to Boulder from the Woods Hole Oceanographic Institution, my first aspiration was to build a new course on physical oceanography, but a different kind of course. I wanted it to be a course really about climate dynamics, from the unique perspective of the upper ocean—right where it dances with the atmosphere. This makes it unique and accessible, and a bit of a different flavor than the traditional “GFD” take on oceanography. After iterating for several years, I decided it was time to encapsulate the whole body of material into a single textbook for students from across the Earth sciences who might be interested in the physics of the ocean, its interaction with the atmosphere, and how it plays such a crucial role in climate variability and change.
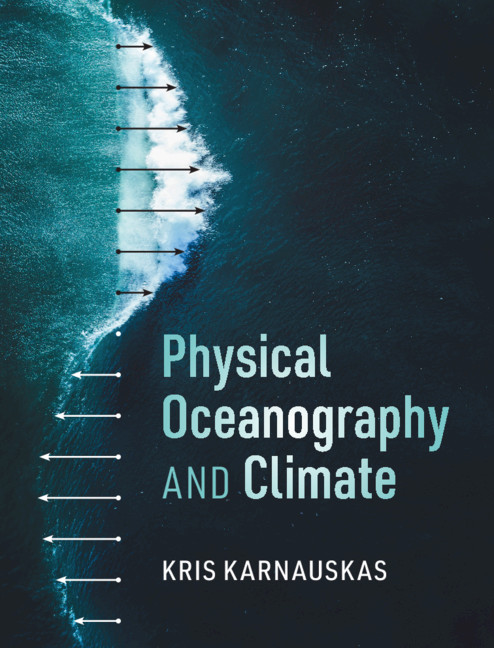
There are two features of my book Physical Oceanography and Climate that I think instructors and students will especially appreciate. The first is the set of illustrations in each chapter. I know; all textbooks have pictures and graphs, but I really poured my heart into these. This is because—and I’m not afraid to admit—I’m a visual learner first. I have learned to never underestimate the power of a conceptual understanding of a complex or theoretical concept, and simple yet effective visuals that reveal the key moving parts go a long way.
This book seeks to meld mathematical and conceptual approaches to learning at every step along the way. Many of the figures in this book, I believe, can be the basis for a lengthy discussion in the classroom, or a good, long think as a student prepares for an exam. When one can comfortably walk themselves through an illustration like the one below, they understand the gyres and why the Great Pacific Garbage Patch is a lasting environmental problem.

Figure 6.5 Schematic illustration of the mechanisms involved in the wind forcing of the subtropical ocean gyres, valid for the Northern Hemisphere. Wind in blue, sea surface height in solid red, subsurface isotherms (thermocline) in dashed red, Ekman transports in gray, Ekman pumping velocity in black, and geostrophic current in black. The thick transparent arrows (shown only in step A) represent the surface branches of the Hadley and Ferrel cells.
The second feature I think you’ll enjoy is one we’ve called Dive into the Data. This is a set of insets embedded into each chapter that provide easy, direct gateways to popular data sets used in ocean and climate research—including observations and model output. In total, there are 27 individual data sets provided via Dive into the Data boxes, and each chapter has some end-of-chapter questions requiring analysis of data. Why did I do this? Because almost every one of these data sets come from a different institution or government agency with a different kind of portal, different data formats, quality control flags, and the metadata are either inadequate or too jargony. Luckily, I have needed to use tons of such data sets in my research career so far. I selected these 27 data sets because they were either used in the production of the illustrations that I made for the book, or they might make engaging small group activities in the classroom or lab, insightful homework assignments, and awesome term projects.
You’ll find all of them in a single data file format (MATLAB), with bare-bones scripts to open each of them and start doing some simple analysis, on the book’s Resources page. You don’t need to go hunting for data sets and navigating oceans of dead links—plus the Dive into the Data boxes themselves inside the book give my own straightforward take of how the data sets were produced, what they’re useful for, which figure(s) they went into, and journal articles to dive deeper. You can just take it from words on a page that the ocean and atmosphere are a coupled system, or you can see it come alive for yourself with real data from floats, satellites, and climate models.
I’ll be hosting a live webinar on June 17 at 1:00 PM EDT, and I would love to chat with you about any topic or feature of the book! Join here
—Kris Karnauskas
Author Bio: Kris Karnauskas is a Fellow of the Cooperative Institute for Research in Environmental Sciences (CIRES) and an Associate Professor in the Department of Atmospheric and Oceanic Sciences (ATOC) at the University of Colorado Boulder, with secondary faculty appointments in the CU School of Medicine and the Colorado School of Public Health. Prior to joining the CU Boulder faculty, Kris spent six years on the faculty of the Woods Hole Oceanographic Institution (WHOI) and the MIT-WHOI Joint Program in Oceanography (also teaching at Boston College) followed by sabbatical at the Institut Pierre Simon Laplace (IPSL) in Paris, France through a Research Fellowship from the Alfred P. Sloan Foundation. Kris completed his B.S. at the University of Wisconsin-Madison and Ph.D. at the University of Maryland-College Park, both in Atmospheric and Oceanic Sciences, followed by a postdoctoral fellowship in Ocean and Climate Physics at the Lamont-Doherty Earth Observatory of Columbia University. Kris currently serves as Editor of the Journal of Geophysical Research-Oceans and recently served on the Scientific Steering Committee (SSC) of the U.S. Climate Variability and Predictability Program (US CLIVAR). He is also frequently a contractor to the United Nations Development Programme, providing expertise on regional climate change impacts for small island nations. Finally, Kris was the recipient of the 2017 Ocean Sciences Early Career Award from the American Geophysical Union (AGU) “for important contributions to better understanding the tropical oceans and atmosphere.”
For more on the author, please visit https://www.colorado.edu/oclab/kris-karnauskas or follow him on Twitter (@OceansClimateCU).
Keep up with the latest from Cambridge University Press on our social media accounts.


Latest Comments
Have your say!