

Products and services


“Climate extremes cost human lives. They do harm to the economy. Examples are the Elbe flood in 2002, the European heatwave in 2003 or hurricane Katrina in 2005. The big question is how global climate change influences climate extremes. This plagues decision-makers as well as climate researchers.” This is how the preface starts. How to approach the big question?
My preferred approach is based on the ideas of the philosopher Plato. That means, assume the existence of a climate reality in space and time, a reality also about the big climate question. The truth is not exactly known to us, but we can approach it by means of data and statistical analysis. We make an inference of climate reality with uncertainties. We report our results with error bars. We write as clearly as possible (see Part 3 of the blog). We support readers with the data and the software used for the analyses. This helps them to replicate and understand what we did. The climate research community proceeds jointly to get closer to the climate reality. Indeed I have the optimism that humans can learn.
More names on the scientific method? Take Immanuel Kant or Karl Popper. Ignore the philosophers who think it is fancy to speculate whether truth exists. Or whether it is a mere social construct. Physics, the climate system and big question on climate extremes are rather unimpressed by such attempts. A couple of years ago I posted a blog series (in German) on floods and climate at some German climate blog. I got a few critical remarks by sociologists. No problem, just ignore such.
Fine. In the book, after the reader has been introduced to the big question (Chapter 1), the first to present were the data (Chapter 2) used to illustrate the statistical methods (Chapter 3). Let us ignore the formulas here. The major target of the analyses is the rate of occurrence of extremes per time unit. For example, how many hurricanes of a certain category happened per season?
Since climate changes with time, we have to admit a time-dependent occurrence rate. The uncertainties in occurrence-rate estimation are obtained by computing-intensive mathematical simulations. That means, use a random number generator and produce artificial series of events, which you then re-analyse for the occurrence rate. You repeat this exercise many times. From the many simulated occurrence-rate curves, you can then construct confidence bands. For example, a 90% confidence band comes from discarding the upper 5% of the simulation values and the lower 5%. This is called a percentile confidence band. (For the expert: the book advocates the usage of a more sophisticated, high-accuracy band of type percentile-t.) A typical result curve looks like this.
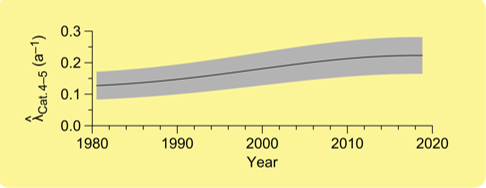
What do we see here? The horizontal axis is time, the past four decades. The vertical axis is occurrence rate of major hurricanes (categories 4 to 5) making landfall in the United States of America. The units are one over years. Conventionally, we use the Greek symbol λ (lambda). The “hat” on top of λ indicates that this is an estimate. The solid line is the estimated time-dependent occurrence rate curve. The shaded area is a 90% percentile-t confidence band. The true occurrence rate at a certain time is with a chance of 90% within the shaded band. The major result is an increasing trend in hurricane occurrence. The current value is about 0.2 one-over-years units, that means, one major event every fifth year. This means on average such an event happens, not exactly every fifth year (then hurricane risk prediction would be fairly easy). Although the uncertainties are pretty large, the trend is there.
My analysis job is done at this stage. The methods the textbook presents allow the calculation and the construction of such time-dependent risk curves. Analysts may use the risk curves as a basis for designing reinsurance products. Meteorologists may use the curves to test hypotheses about driving factors. Climate researchers have another curve demonstrating the impacts of climate change. Stakeholders may make better-informed decisions. To repeat, the research community proceeds jointly to get closer to the reality about the time-dependent risk of hurricanes and other types of extremes. These will be covered in the next blog article.
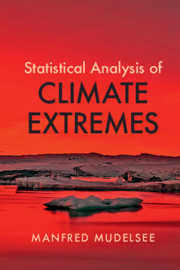
The book published by Cambridge University Press in May 2020. It is available to order in print, online for individuals or online for institutions.
Online material for the book: https://www.manfredmudelsee.com/textbook/index.htm
Hochwasserrisiko: Persönliche Anmerkungen von Manfred Mudelsee, Blog „Die Klimazwiebel“ (In German) https://klimazwiebel.blogspot.com/2011/12/hochwasserrisiko-personliche.html (last access 15 June 2020)
Plato picture, excerpt from a painting from circa 1325 to 1335
https://www.gla.ac.uk/myglasgow/library/files/special/images/chaucer/H231_0276wf.jpg (last access 15 June 2020)
Statistical Analysis of Climate Extremes: The Blog about the Book. Part 1: Corona
https://www.cambridgeblog.org/2020/05/statistical-analysis-of-climate-extremes-the-blog-about-the-book-part-1-corona/
Statistical Analysis of Climate Extremes: The Blog about the Book. Part 2: The Cover
https://www.cambridgeblog.org/2020/05/statistical-analysis-of-climate-extremes-the-blog-about-the-book-part-2-the-cover/
Statistical Analysis of Climate Extremes: The Blog about the Book. Part 3: Content
https://www.cambridgeblog.org/2020/06/statistical-analysis-of-climate-extremes-the-blog-about-the-book-part-3-content

Manfred Mudelsee is founder of the research company Climate Risk Analysis, and a visiting scientist at the Alfred Wegener Institute Helmholtz Centre for Polar and Marine Research. ...
View profile >Keep up with the latest from Cambridge University Press on our social media accounts.


Latest Comments
Have your say!