

Products and services


As cities, counties and states begin to relax social distancing guidelines, it is important for local and state public health organizations to conduct rigorous disease surveillance looking for indications of COVID-19 resurgence. Recognizing that there will continue to be some level of disease incidence in the population, the question is whether relaxing social distancing guidelines leads to increases in COVID-19 cases that would necessitate modifications to existing policy. Such an increase might be slow and gradual or it could be sudden and large.
Disease surveillance can be conducted at a variety of levels, from tracking and tracing individual diagnosed cases to monitoring aggregate testing or case data as a measure of disease incidence in a specific or more general population. The former is a medical and epidemiological problem while the latter is both a statistical problem, in the sense of using samples of data taken over time to infer trends in a population, as well as an epidemiological problem if a potential increase is identified.
At its most fundamental, this is an exercise in separating signal from noise, where the goal is to quickly identify an increase in disease incidence (the signal) in the presence of data that will naturally fluctuate over time (the noise). The extremes will generally be clear: an individual who presents with obvious COVID-19 symptoms and tests positive, or a large outbreak with many individuals with symptoms and/or positive test results. Identifying more subtle changes in disease incidence, prior to and in order to head off a large outbreak, is more challenging.
The detection challenge is partly quantitative, where it can be quite difficult to identify a subtle signal amid noisy data. But the challenge is compounded by practical issues related to COVID-19 which a disease that can spread asymptomatically (or nearly so) and for which case outcomes may lag policy changes by weeks. It may be further compounded by differing organizational priorities, where the existence of subtle changes may be disputed and yet where it is critical to quickly identify increases in disease incidence before they become exponential.
Our focus here is on the statistical tools to address the quantitative problem, though note that proper implementation and transparent use of the right tool may also help address some of the other challenges. The fundamental idea is quite simple. Using historical data, the existing or desired disease incidence rate is quantitatively characterized, typically in terms of an average rate and some measure of variability such as the standard deviation. Then future data is monitored in comparison to the historical, where if it is significantly above the historical average, then that would trigger an epidemiological investigation into whether there is an event that warrants some sort of intervention and/or policy change.
The figure below illustrates one approach using COVID-19 case data from Knox County, Tennessee. It uses a moving average and standard deviation from the previous 14 days, less any unusual spikes in the data, to establish a warning threshold (the yellow line) and signal threshold (the red line) at 1.5 and 3 standard deviations above the moving average. In the figure, the yellow and red bars denote counts that have exceeded the warning threshold or the signal threshold, respectively, which is an indication that the count for that day was unusually high compared to observations from the previous two weeks.
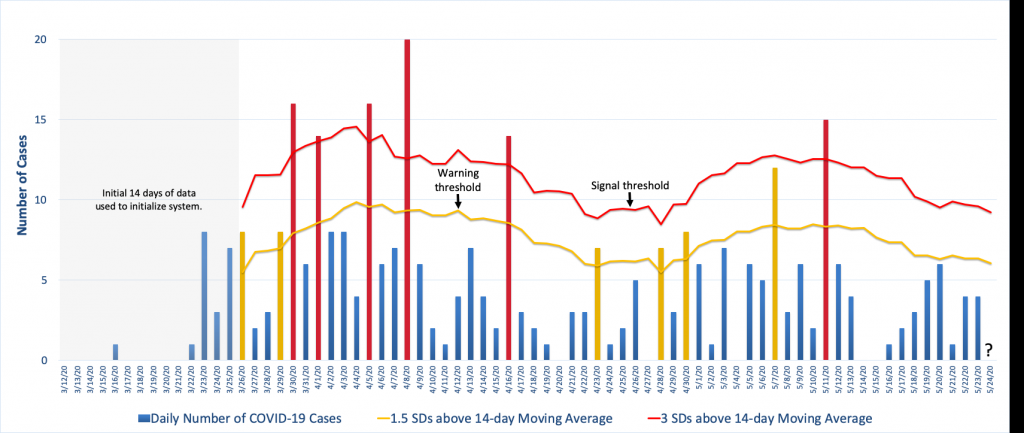
The way this is particular surveillance algorithm is implemented is that each day the 14-day moving average and standard deviation is calculated from which new warning and signal thresholds are specified. Then the next day’s case count is compared to these thresholds and appropriate action is taken if the observed count exceeds one or both of them. For example, to the far right in the figure we see that the thresholds for May 24th have been calculated using the data from May 10-23 less the spike on May 11th. The question is where the observed count, when it is observed, falls in relation to that day’s thresholds. (See Illustrative Surveillance Example Using Knox County TN COVID-19 Case Data.xlsx for the Excel spreadsheet with the calculations.)
Note how the figure shows the background incidence fluctuating over time and this is reflected in threshold changes. Because this algorithm bases the decision thresholds on a 14-day average, it allows for this type of variation, though depending on the surveillance goals this may or may not be desired. For example, this algorithm will be very effective at detecting large increases quickly but it will be poor at detecting a slow steady increase in disease incidence. For that, there are other algorithms that are more effective.
Now, while the idea is simple, algorithmic options and implementation details add complexity. For example, the choice of threshold requires making a sensitivity-specificity tradeoff in terms of speed of detection of an increase in incidence versus the rate of false positive signals, a choice that has both practical and perhaps political implications. There are also algorithmic options, where certain algorithms are more appropriate for some types of data and, as we just mentioned, some algorithms are better suited to detect certain types of incidence changes than others. And, there are computational details as well as basic questions about which historical data to use to characterize the “normal” background disease incidence and how to update that information as time progresses.
Unfortunately, we don’t have the space here to address all of these issues. However, important implementation details aside, hopefully this short note has made it clear that the appropriate use of these types of surveillance tools can help frame the process by which decisions are made and help remove subjectivity and seat-of-the-pants decision making. Perhaps most importantly, from a public health viewpoint, appropriate implementation of a good surveillance system can improve data and decision making transparency and thereby increase confidence in the public health system.
For Further Reading
Fricker, R.D., Jr. (2013). Introduction to Statistical Methods for Biosurveillance, with an Emphasis on Syndromic Surveillance, Cambridge University Press.
Fricker, Jr., R.D., and S.E. Rigdon (2018). Disease Surveillance: Detecting and Tracking Outbreaks Using Statistics, Chance, 31, 12-22.
Rigdon, S.E., and R.D. Fricker, Jr. (2019). Monitoring the Health of Populations by Tracking Disease Outbreaks and Epidemics: Saving Humanity from the Next Plague, CRC Press.

Dr. Ronald D. Fricker, Jr. is a Professor of Statistics and the Associate Dean for Faculty Affairs and Administration in the Virginia Tech College of Science. He holds a Ph.D. an...
View profile >Keep up with the latest from Cambridge University Press on our social media accounts.


Latest Comments
Have your say!