

Products and services

From milliseconds to billions of years the atmosphere is highly variable, but thanks to aircraft, satellites and ice and ocean cores and other proxies, it has been quantified to an unprecedented degree; atmospheric science ought to be much more exact. Yet comprehending its extraordinary variability requires an appropriate conceptual framework and over the last decades, the main approach has consisted in little more than cataloguing processes each functioning over relatively narrow ranges of scale: often referred to as “oscillations”. Examples include the familiar El Nino-La Nina transitions, the more exotic North Atlantic, Southern and Pacific Decadal Oscillations or – at much longer scales – the pulsating advance and retreat of ice sheets over hundreds of thousands of years. It is the idea that atmospheric variability when viewed as a function of frequencies of oscillations – its “spectrum” – consists essentially of an uninteresting void punctuated by specific oscillations, each associated with specific mechanisms acting at specific timescales. Figure 1 – that currently adorns the paleoclimate data site of the National Oceanographic and Atmospheric Administration (NOAA) – provides a graphic illustration with its caption clearly declaring “… the figure is intended as a mental model to provide a general “powers of ten” overview of climate variability, and to convey the basic complexities of climate dynamics for a general science savvy audience.” This nice, neat “mental picture” still dominates atmospheric research, yet it is astronomically wrong.
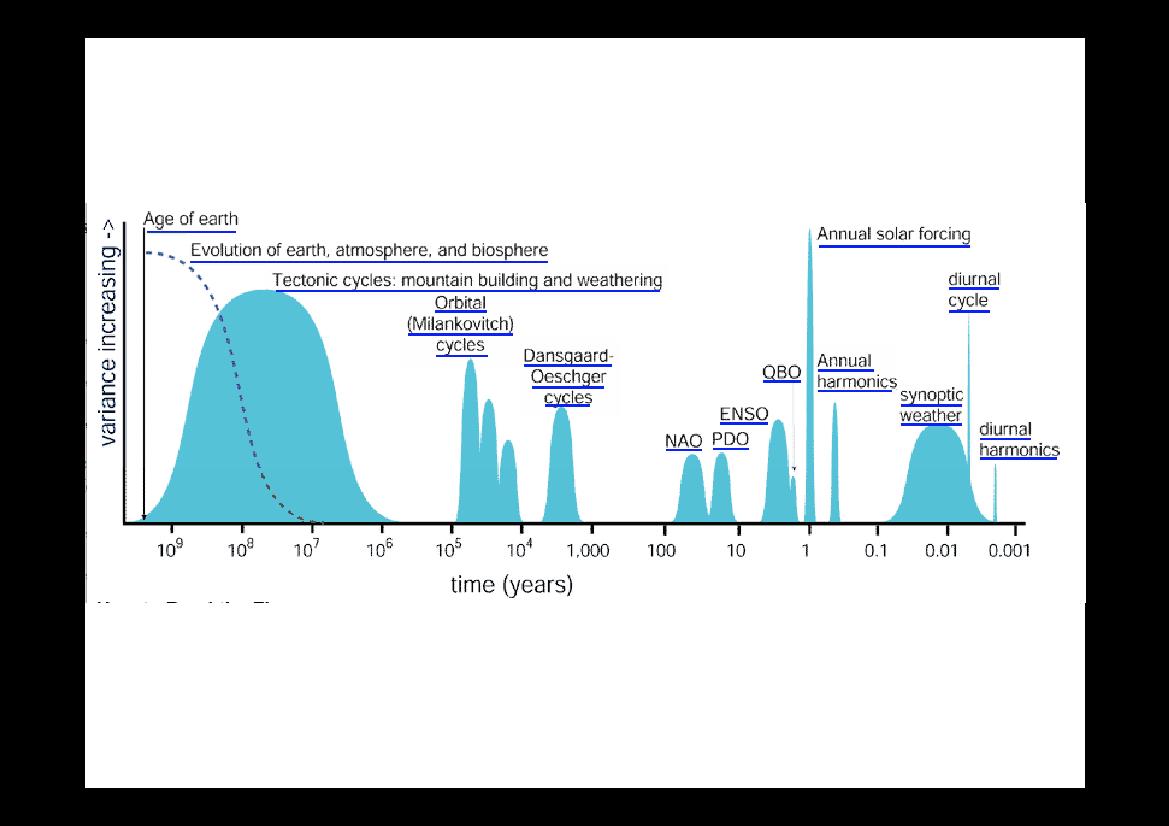
Fig. 1: The updated version of Mitchell’s spectrum reproduced from NOAA’s NCDC paleoclimate web site (http://www.ncdc.noaa.gov/paleo/ctl/about1.html). The “background” on this paleo site is perfectly flat; hence in comparison with the empirical spectrum in fig. 2, it is in error by an overall factor ≈ 1016.
As NOAA acknowledges, their schematic is no more than an update of an iconic graph published at the dawn of the paleoclimate revolution ([Mitchell, 1976], see fig. 2) which – given the absence of data at the time – was admitted to be only an “educated guess”. Within fifteen years of its publication, developments in ocean, ice core and other temperature proxies had already shown that it was wrong by a whopping 10 or more orders of magnitude ([Lovejoy and Schertzer, 1986], [Shackleton and Imbrie, 1990])! Today the full extent of the error in the spectral density is closer to a factor of a quadrillion (in fig. 2 the range over which the actual spectrum varies compared with the roughly flat background).
In spite of this, Mitchell’s figure continues to be reproduced in modern climate reviews and textbooks ([Dijkstra and Ghil, 2005], [Fraedrich et al., 2009], [Dijkstra, 2013]). And in case a skeptic fails to be convinced, the NOAA site assures us that just “because a particular phenomenon is called an oscillation, it does not necessarily mean there is a particular oscillator causing the pattern. Some prefer to refer to such processes as variability.” Variability has thus been reduced to oscillations, the spectral continuum and its quadrillion has been deleted.
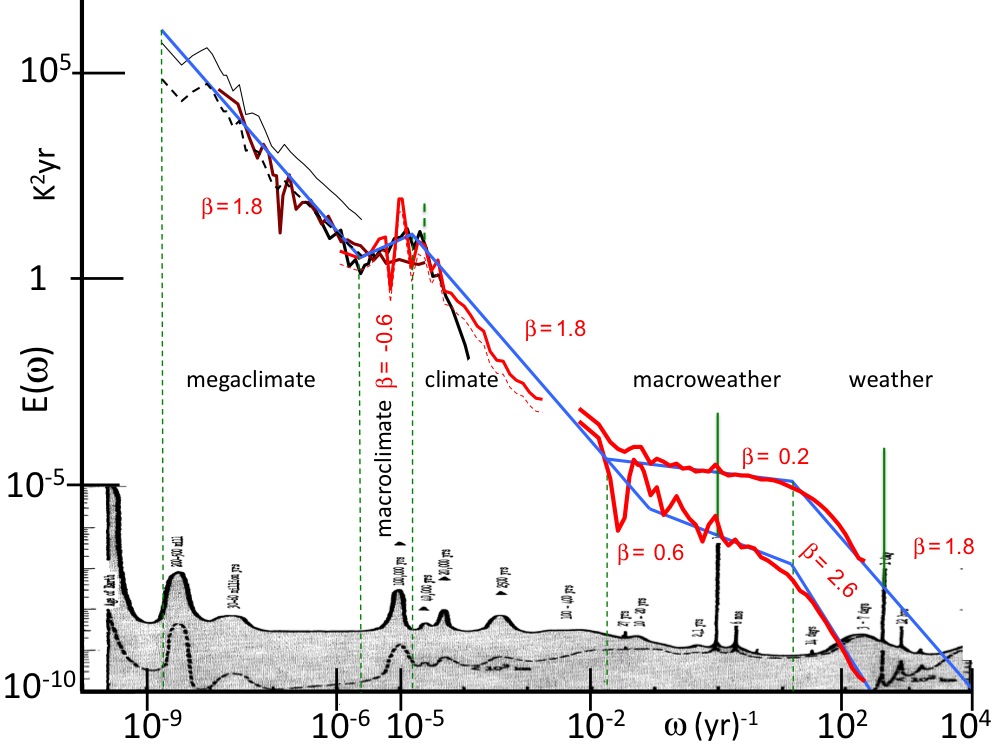
Fig. 2: A comparison of Mitchell’s relative scale, “educated guess” of the spectrum (bottom, [Mitchell, 1976]) with modern evidence from spectra of a various the series; the details of these are in [Lovejoy, 2014]. All the spectra were averaged over logarithmically spaced frequency intervals (10 per order of magnitude), thus “smearing out” the daily and annual spectral “spikes”. These spikes have been re-introduced without this averaging, and are indicated by green spikes above the red daily resolution curves. Also shown is the other striking narrow spectral spike at (41 kyrs)**-1 (obliquity ≈ a factor 10 above the continuum), this is shown in dashed green since it is only apparent over the period 0.8 – 2.56 Myr BP.
The blue lines have slopes indicating the scaling behaviours (E(o) ≈ o**-beta). The thin dashed green lines show the transition frequencies deduced from the spectra; these are at (20 days) **-1, (50 yrs) **-1, (80kyrs) **-1, and (500 kyrs) **-1. At the far right, the blue line is close to the detrended hourly data, the exponent is the turbulent value b = 1.8 (and hence presumably continues down to much higher frequencies).
How could the quadrillion be ignored for so long? The answer is that being guided by the wrong “mental picture” is not relevant to practical weather and climate science. These use numerical models that – at least up to 50- 100 years – have roughly the correct spectra so that even with respect to the models, NOAA’s mental picture is wrong by about 5 – 6 orders of magnitude. And we find that practical weather and climate forecasts do indeed treat the spikes as no more than perturbations.
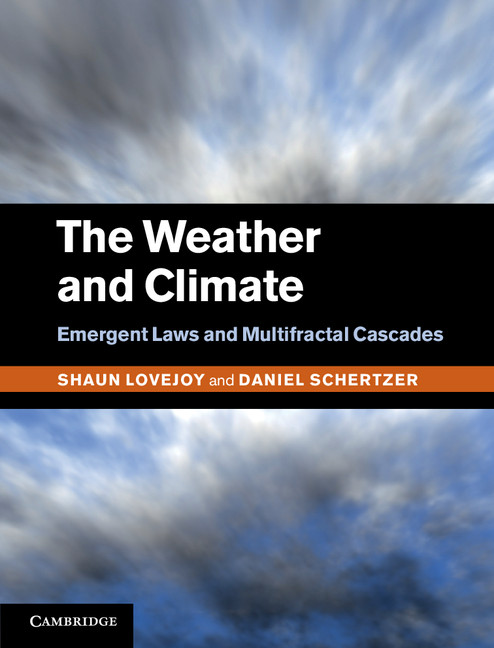
Shaun Lovejoy is the co-author of The Weather and Climate: Emergent Laws and Multifractal Cascades (2013). Lovejoy is Professor of Physics at McGill University, Montréal, and has ...
View profile >Keep up with the latest from Cambridge University Press on our social media accounts.


Latest Comments
Have your say!